
MESHLINK News

Oct 29,2026

Wi-Fi QoS Testing with Candela LANforge: Tri-Band UDP Traffic Allocation on the TP-Link BE800

Looking Beyond Total Throughput

When video streaming, voice calls, and background downloads share a Wi-Fi connection, total throughput alone does not show how bandwidth is distributed among different traffic types.

In this example, we use a TP-Link Archer BE800 as the device under test and LANforge WiFi Test Processor, developed by Meshlink, to configure Candela LANforge and review received throughput. The workflow covers test creation, execution monitoring, and results analysis.

Four UDP traffic groups are configured with different ToS markings and labeled VI (Video), VO (Voice), BE (Best Effort), and BK (Background). The purpose is to observe throughput distribution under competing offered loads.

Test Environment and Method

A 10 Gbps LAN port on the BE800 is connected to a 10 Gbps Ethernet port on the LANforge system. Traffic passes between the wired endpoint and wireless test stations through the BE800.

The DUT is placed in an RF isolation chamber to provide a controlled environment. Uplink and downlink tests are performed separately on the 2.4, 5, and 6 GHz bands, producing six sets of results.

In this article:

  • Downlink (DL): traffic travels from the wired endpoint through the BE800 to the wireless stations.
  • Uplink (UL): traffic travels from the wireless stations through the BE800 to the wired endpoint.

No additional network features were specifically configured on the BE800 beyond the settings required for wireless access, band selection, and channel bandwidth.
Wi-Fi QoS Testing with Candela LANforge: Tri-Band UDP Traffic Allocation on the TP-Link BE800

Creating a QoS Test in the GUI

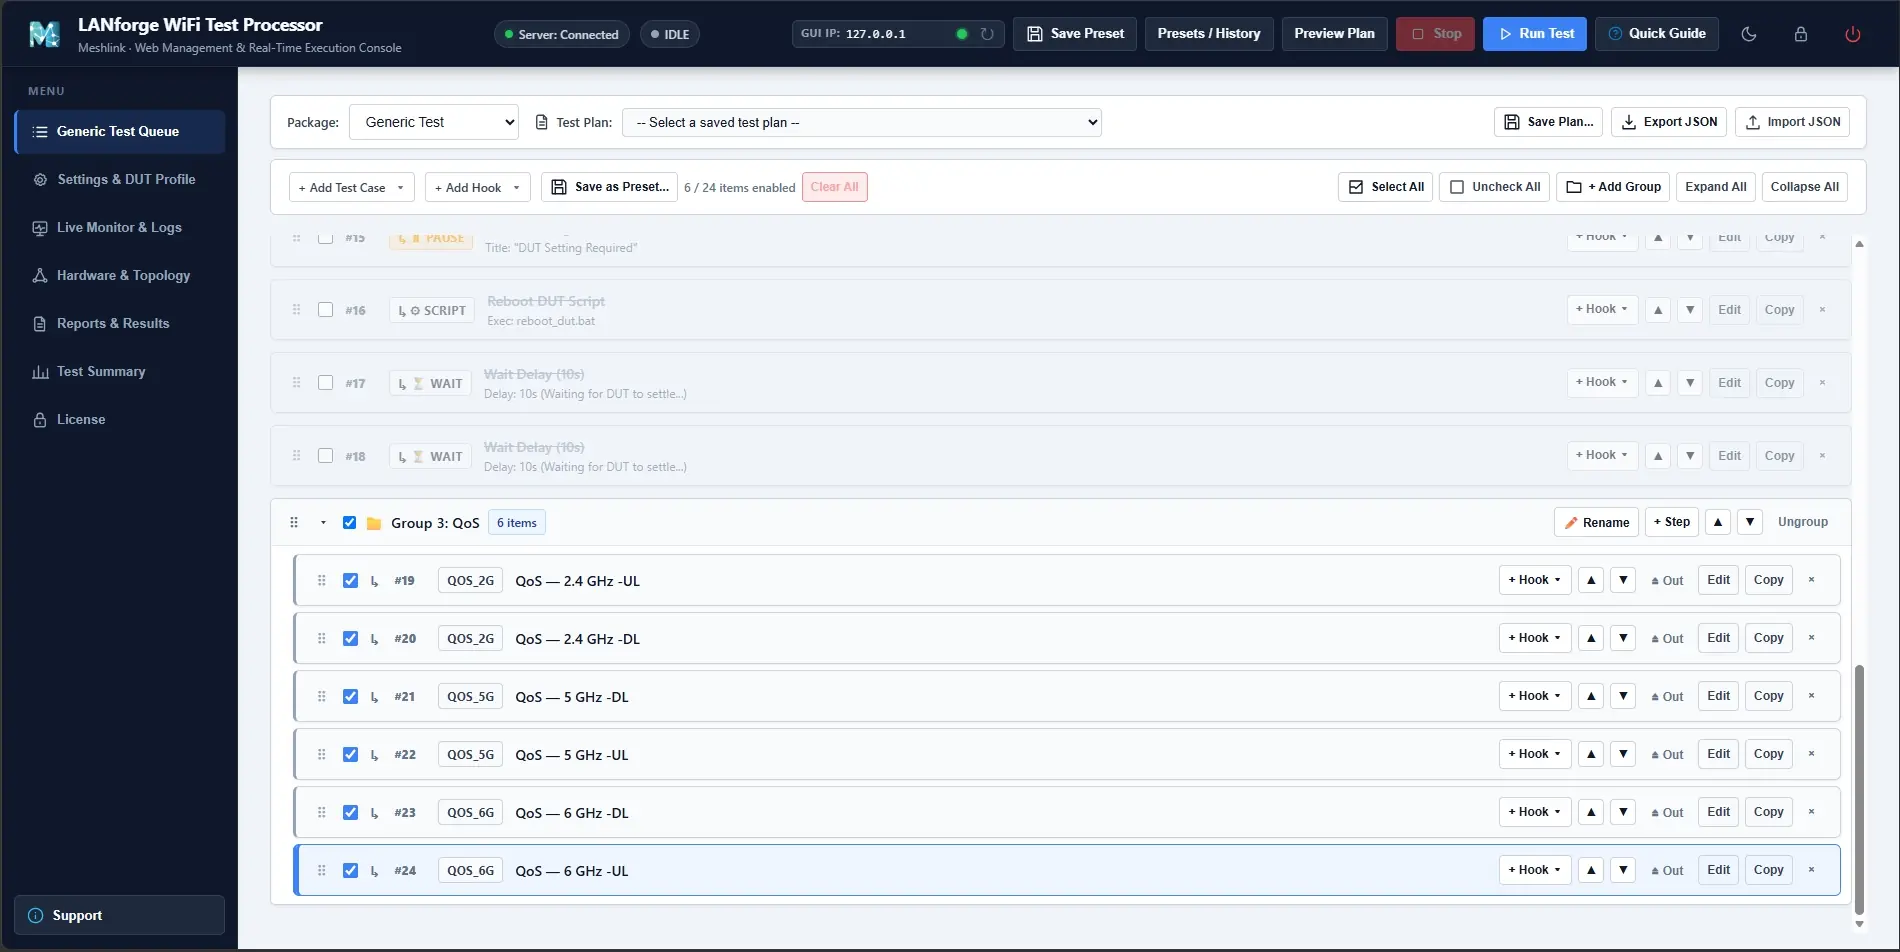
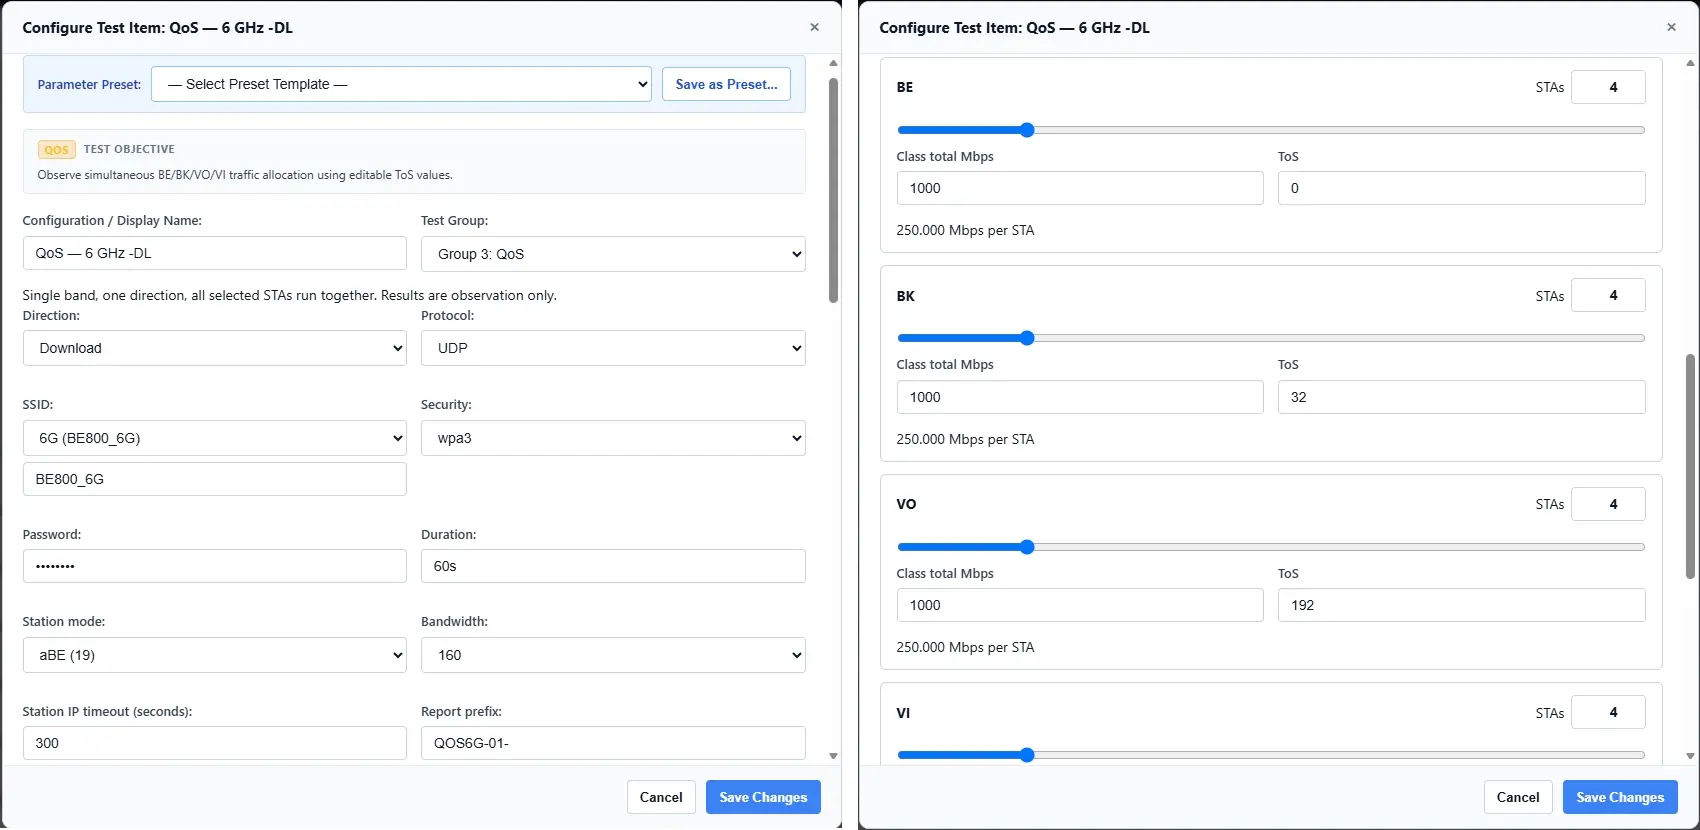
In Generic Test Queue, select Add Test Case and add a QoS test for the required band: 2.4, 5, or 6 GHz. Configure the traffic direction and select UDP as the transport protocol.

Wireless mode and channel bandwidth can be selected from the available settings, subject to the capabilities of the test hardware, frequency band, and DUT. Save the configuration as a test plan to simplify repeat runs or create variations for comparison.

For each traffic class, configure the number of stations, total offered load, and ToS value. In the configuration example, each class contains four stations with a total offered load of 1,000 Mbps, equivalent to 250 Mbps per station. These are configured transmission targets, not measured receive rates.

The screenshots illustrate the configuration workflow. Actual offered loads and station counts vary by test scenario.

Wi-Fi QoS Testing with Candela LANforge: Tri-Band UDP Traffic Allocation on the TP-Link BE800

Monitoring Execution and Reviewing Reports

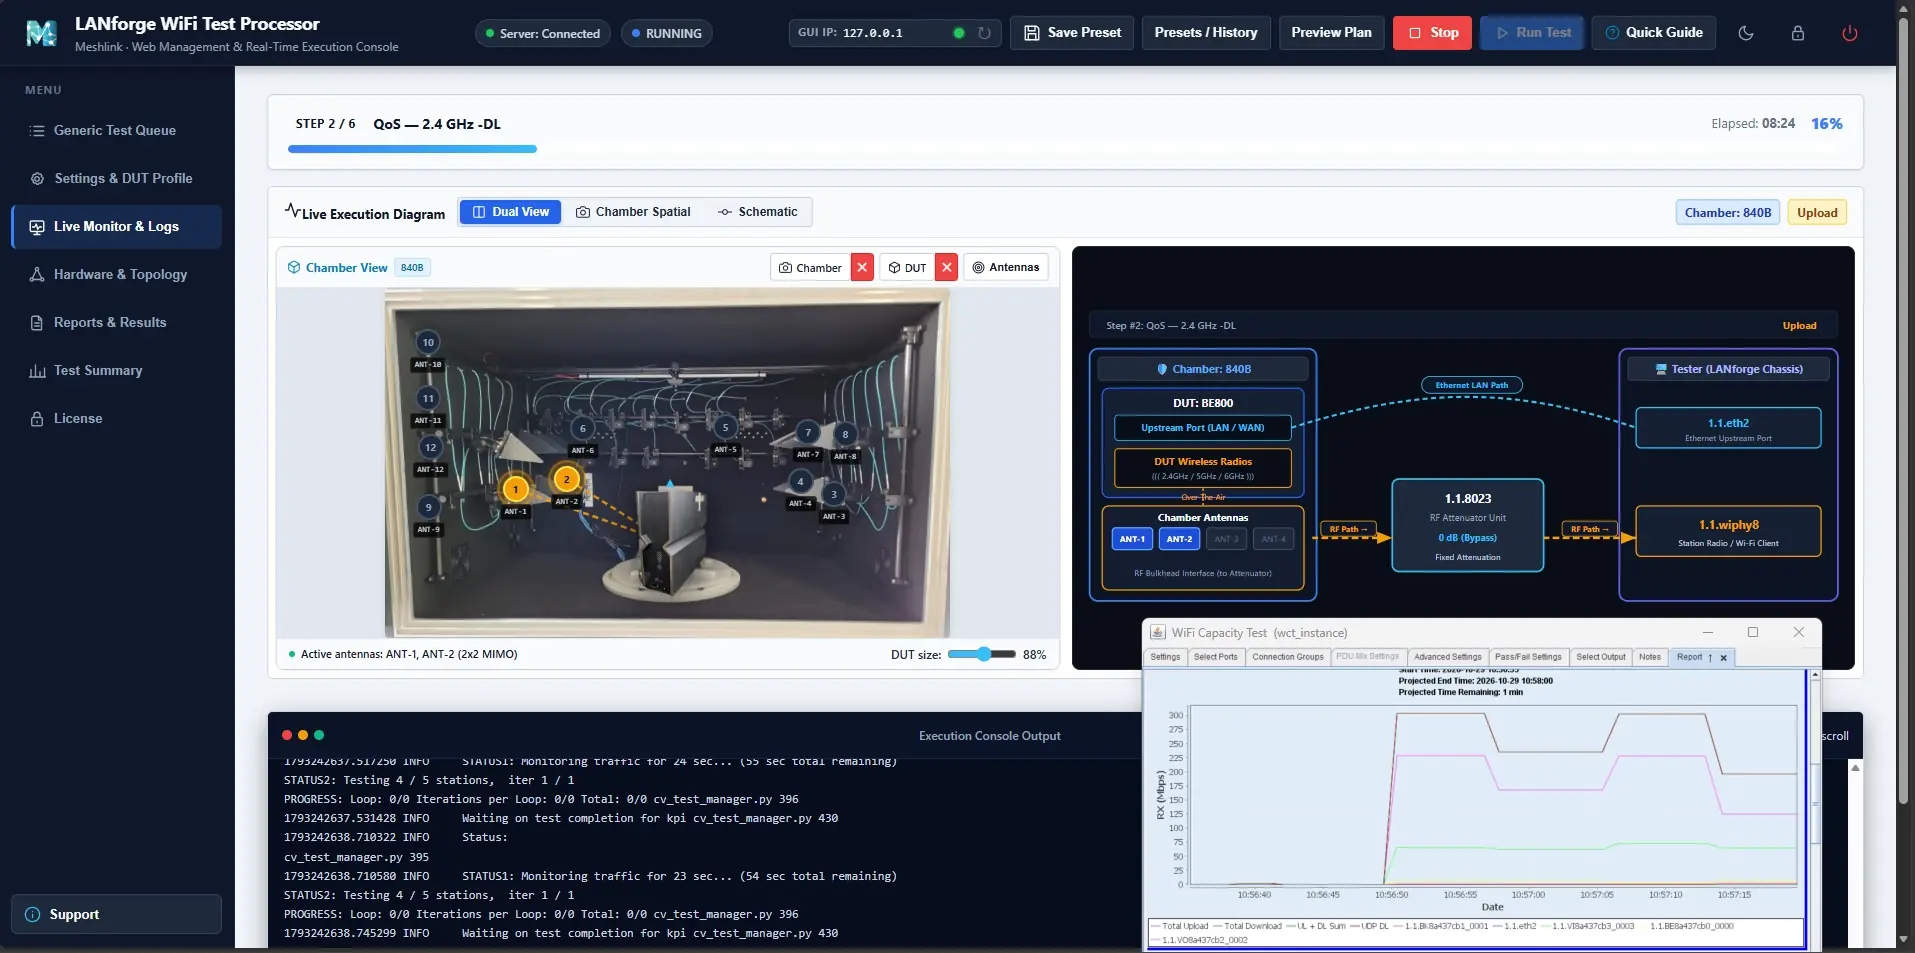
During execution, Live Monitor & Logs provides test progress alongside the uploaded chamber image, positioned antenna markers, and configured test paths. The associated Candela LANforge test window also provides a live view of the running test.

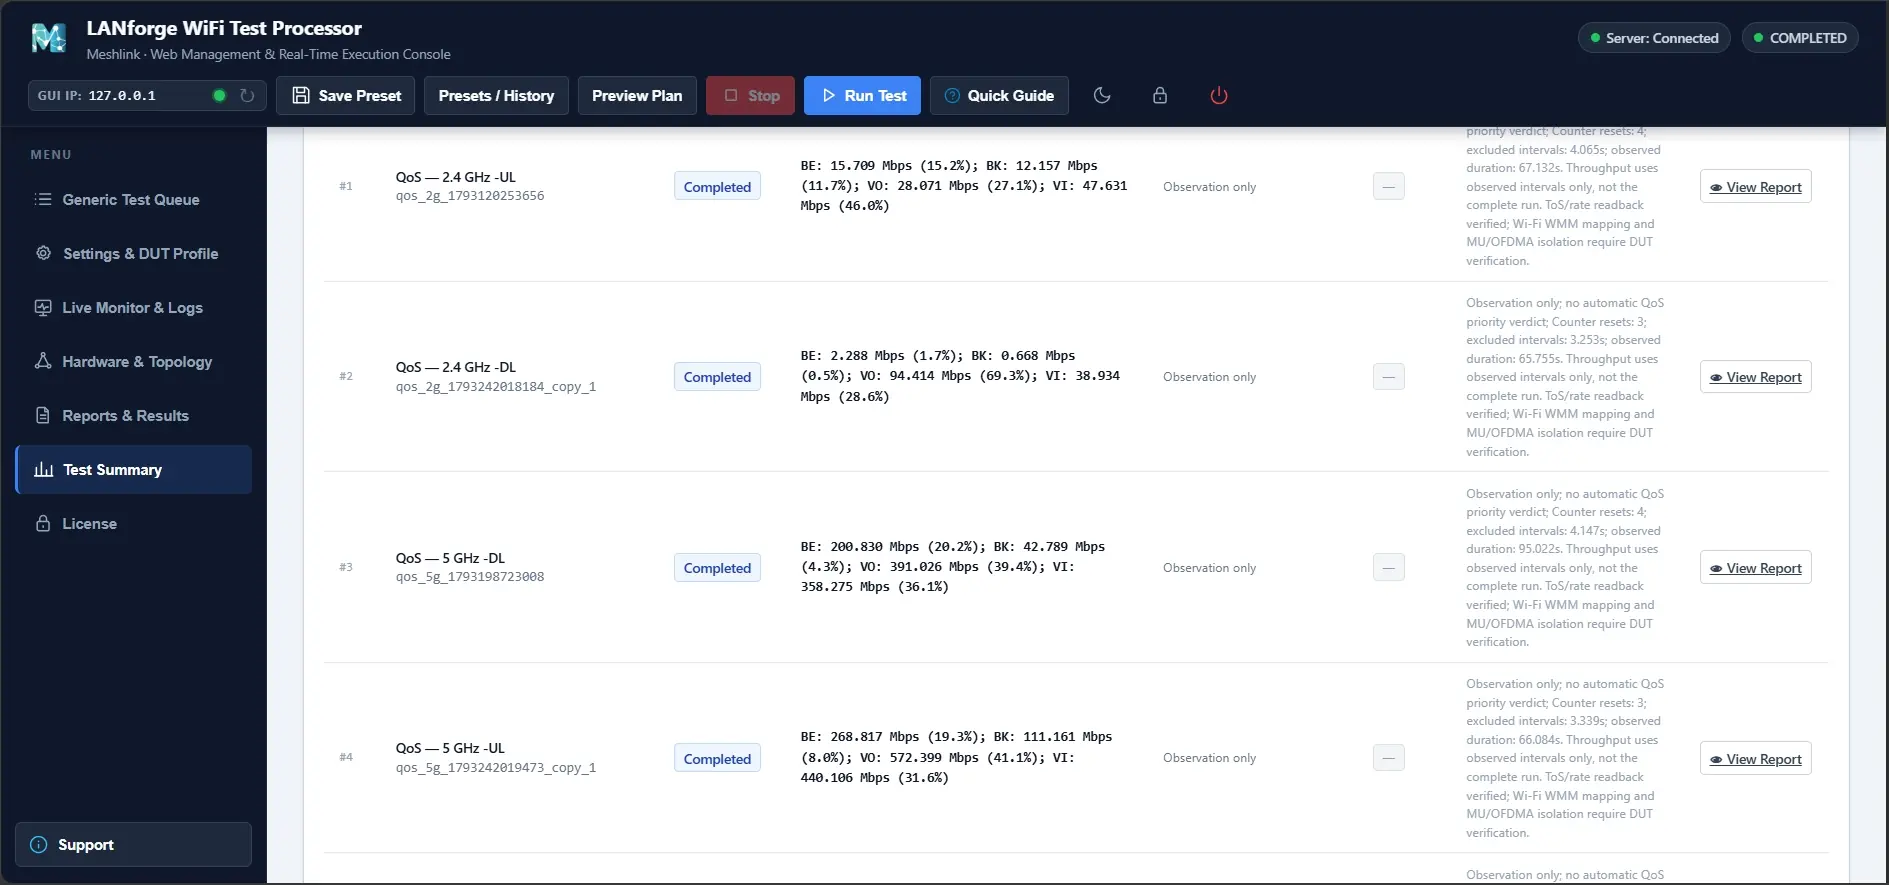
After completion, open Test Summary to review individual test results. Select View Report to examine received throughput by traffic class and station, together with the throughput chart.

Wi-Fi QoS Testing with Candela LANforge: Tri-Band UDP Traffic Allocation on the TP-Link BE800

BE800 Tri-Band UDP Results

The total offered load per traffic class is configured as follows:

Band Offered Load per Class Total Offered Load
2.4 GHz 300 Mbps 1,200 Mbps
5 GHz 600 Mbps 2,400 Mbps
6 GHz 1,000 Mbps 4,000 Mbps

The combined offered load exceeds the received throughput observed in each scenario, allowing the distribution among traffic classes to be examined under competing load.

The following table shows received throughput. Percentages indicate each class's share of the total received throughput.

Band Direction VI Mbps (%) VO Mbps (%) BE Mbps (%) BK Mbps (%) Total Mbps
2.4 GHz DL 38.934 (28.6%) 94.414 (69.3%) 2.288 (1.7%) 0.668 (0.5%) 136.304
2.4 GHz UL 47.631 (46.0%) 28.071 (27.1%) 15.709 (15.2%) 12.157 (11.7%) 103.568
5 GHz DL 358.275 (36.1%) 391.026 (39.4%) 200.830 (20.2%) 42.789 (4.3%) 992.920
5 GHz UL 440.106 (31.6%) 572.399 (41.1%) 268.817 (19.3%) 111.161 (8.0%) 1,392.483
6 GHz DL 981.853 (35.1%) 983.106 (35.1%) 651.545 (23.3%) 180.572 (6.5%) 2,797.076
6 GHz UL 870.713 (27.6%) 937.135 (29.7%) 747.208 (23.7%) 601.945 (19.1%) 3,157.001

Percentages may not total exactly 100% due to rounding. Throughput is calculated over valid observed intervals, excluding discontinuities caused by counter resets, rather than over the complete run. Results are for observation only and do not constitute an automatic QoS priority Pass/Fail verdict.

Wi-Fi QoS Testing with Candela LANforge: Tri-Band UDP Traffic Allocation on the TP-Link BE800

A Closer Look at the 5 GHz Uplink Test

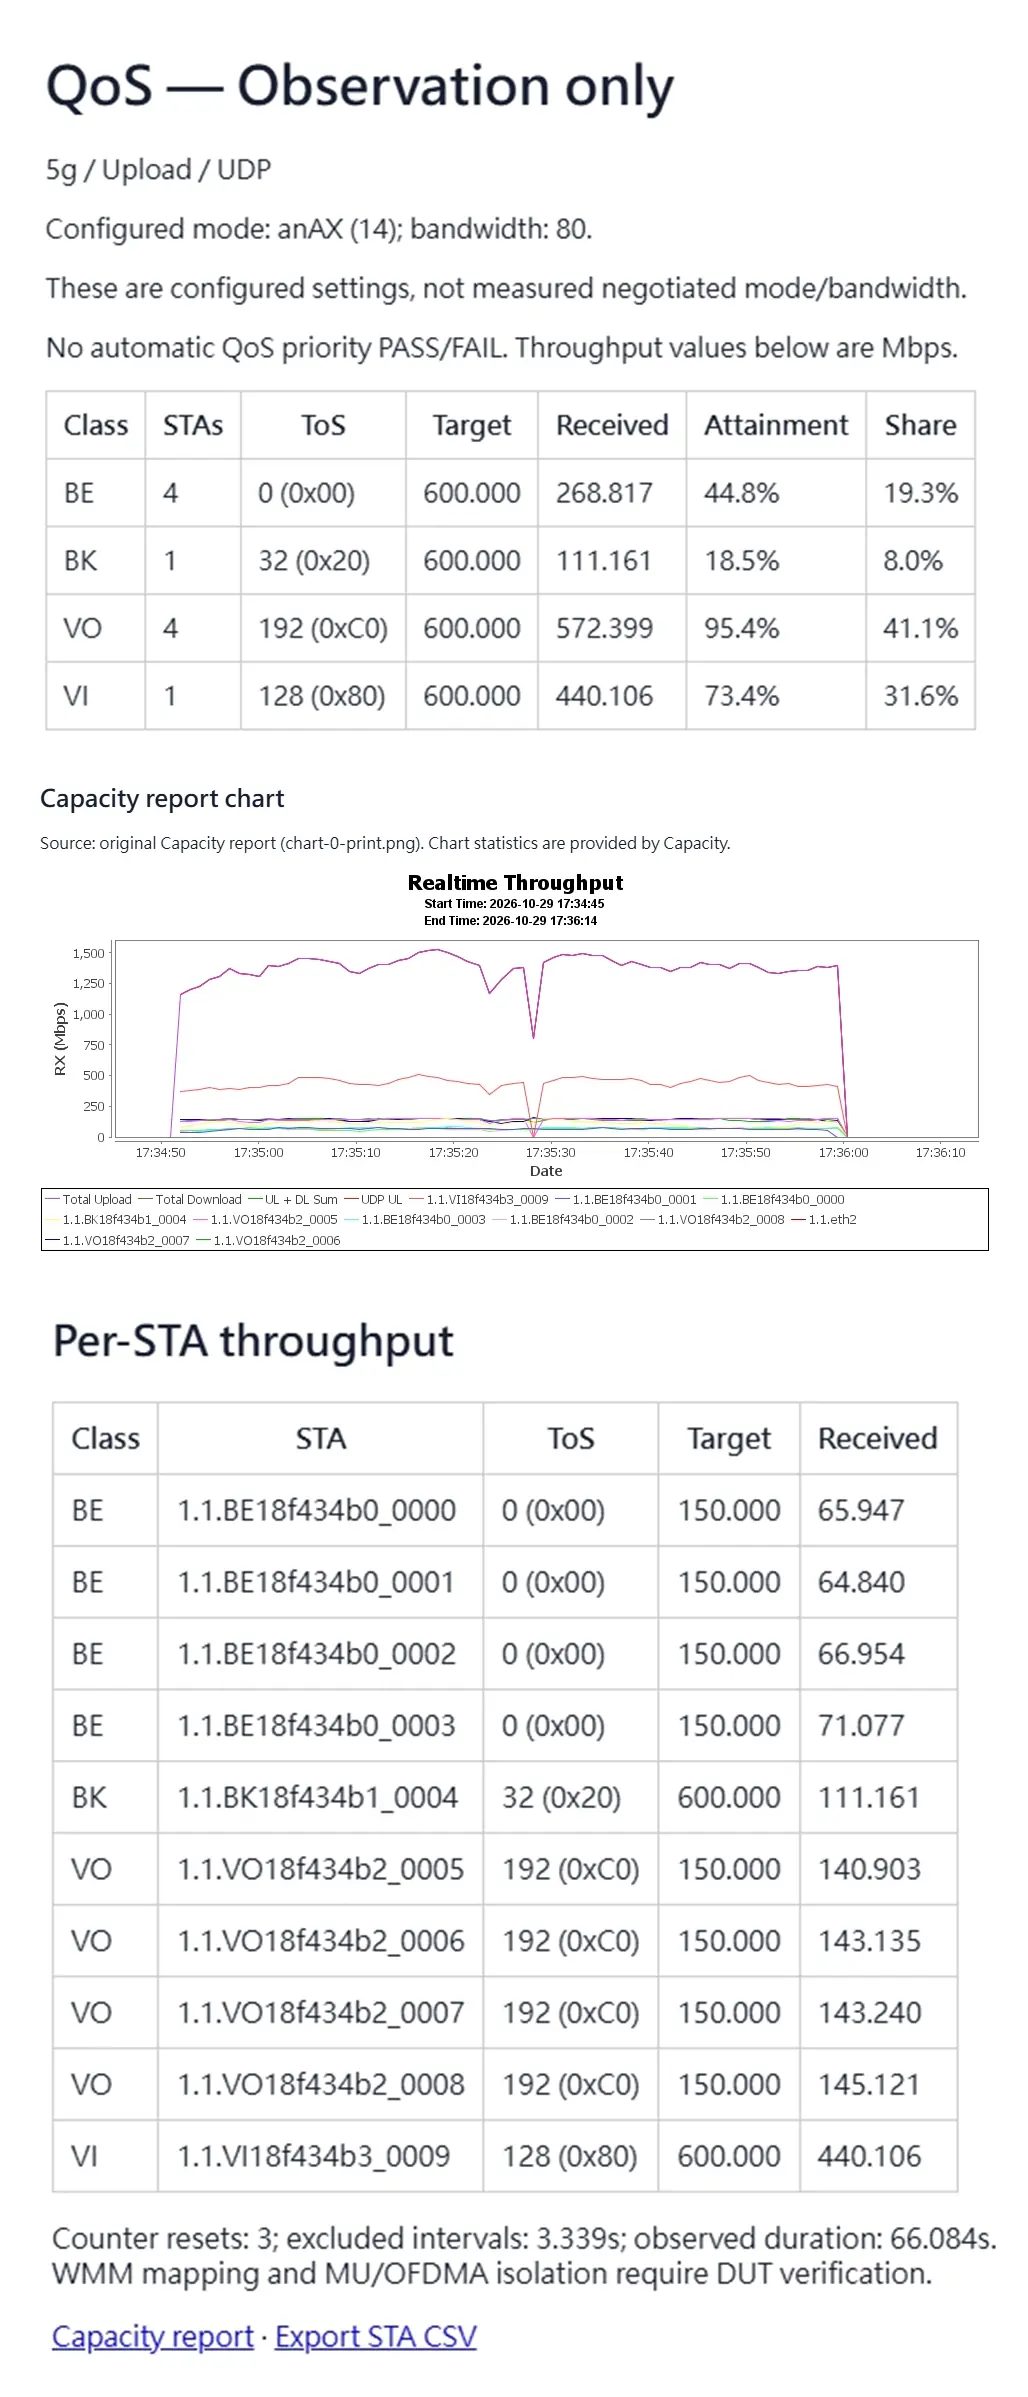
The detailed 5 GHz uplink report shows received throughput for ten stations: four BE, one BK, four VO, and one VI.

Each traffic class has a total offered load of 600 Mbps. The four BE stations are therefore configured for 150 Mbps each, as are the four VO stations. The single BK station and single VI station are each configured for 600 Mbps.

The throughput chart shows changes during the test, while the tables summarize received throughput by station and traffic class. Reviewing both helps distinguish configured load from measured performance.


What the Results Show

In five of the six scenarios, VO has the highest received throughput, followed by VI, BE, and BK. The exception is the 2.4 GHz uplink test, where VI has the highest received throughput.

These measurements illustrate differences in traffic distribution under the selected test conditions. They do not, by themselves, confirm over-the-air WMM access-category mapping or establish a general scheduling rule for the BE800.

Under congestion, traffic scheduling and resource allocation can affect application experience. Further DUT inspection or packet analysis is needed to verify WMM mapping, while latency and jitter require separate measurements.

Further Test Scenarios

This UDP example demonstrates how LANforge's testing capabilities can be accessed through Meshlink's graphical interface to simplify multi-station configuration and test orchestration.

Further investigations could compare TCP traffic, Wi-Fi 7 MLO, and simultaneous uplink and downlink traffic, subject to the capabilities of the test system and DUT. For delay-sensitive applications such as voice, latency and jitter are also useful areas for additional analysis.

For a demonstration, trial, or customized test workflow, please contact Meshlink.

↑